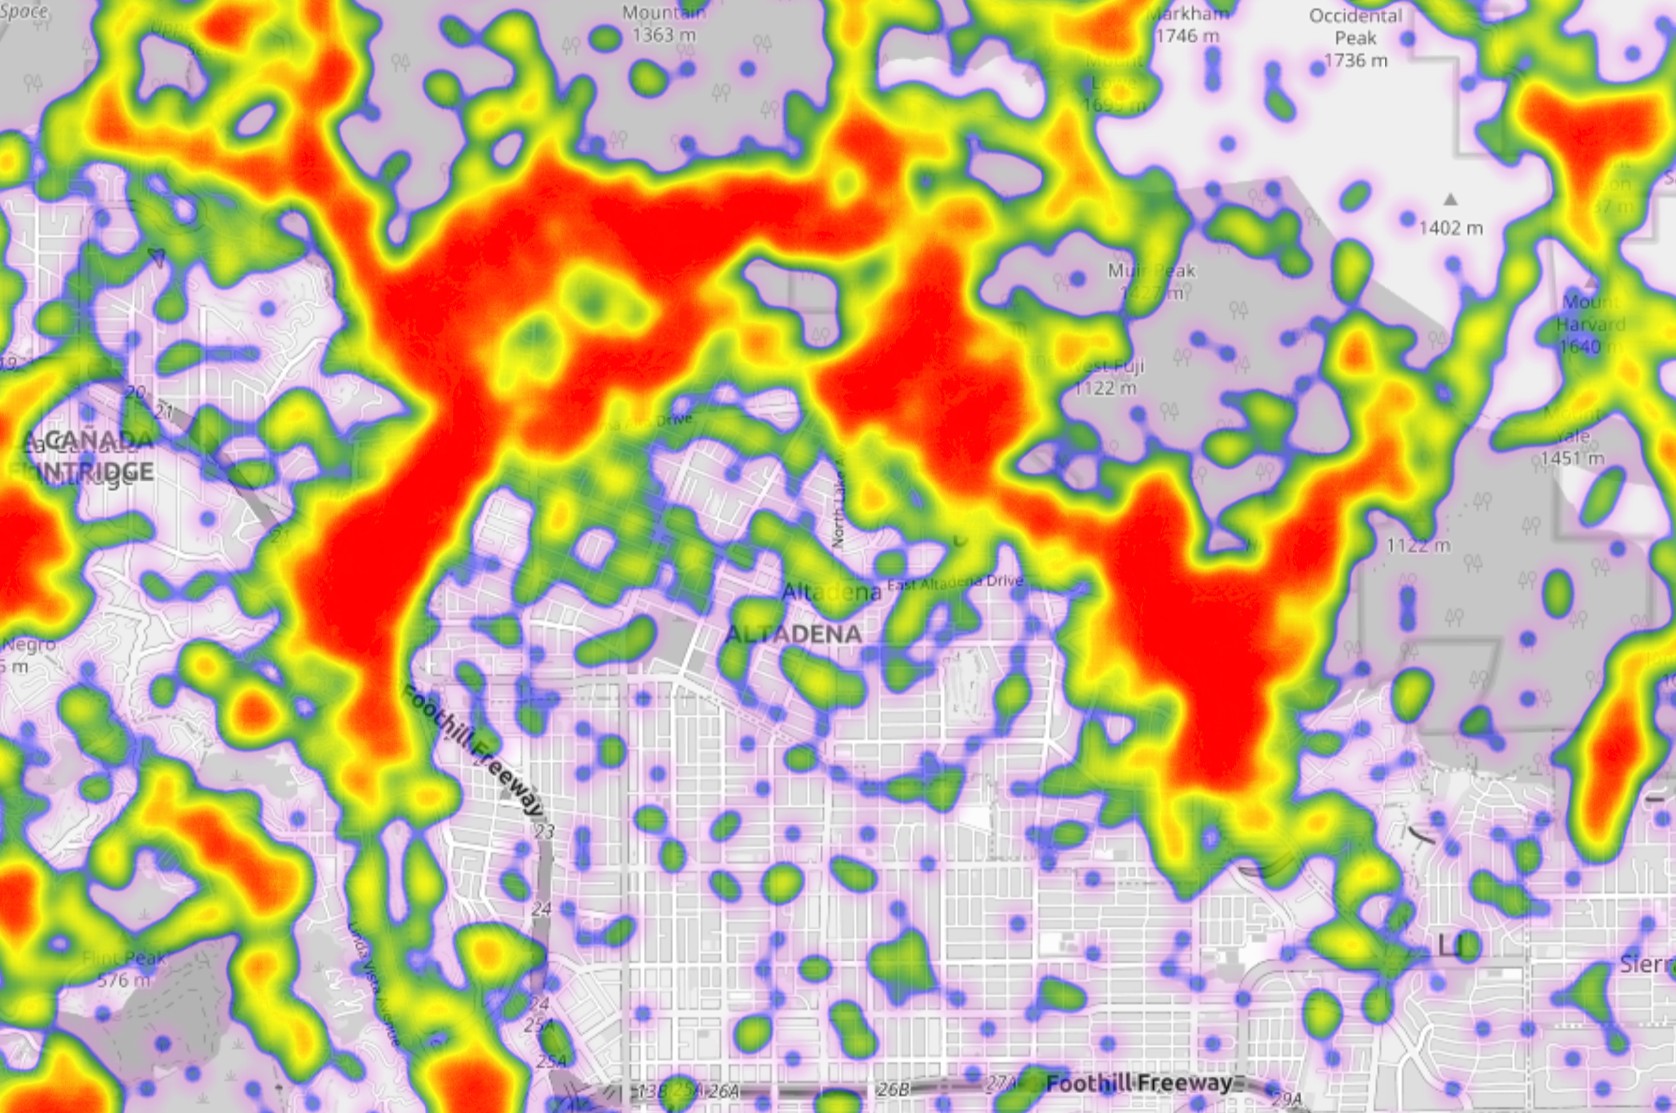
*Example of above map showing that Altadena is surrounded by native plant observations*
The mapping tool is created by a member of the iNaturalist forums. You can take any search from the iNaturalist Explore page (in this case https://www.inaturalist.org/observations?place_id=962&project_id=calflora-native-plants-of-california&quality_grade=research&subview=map) and take everything after the ? and paste it into the url of the below link and it will show it as a heat map rather than points. You can change the URL of the above map with any iNaturalist parameters like e.g. showing a different Genus or Project ID on the fly, which lets you you do more targeted searches for whatever you're looking for.
The project I am using to filter native plants on iNaturalist is one I created last year with a lot of work. You can read about it here: https://www.inaturalist.org/journal/maxo/79403-california-native-invasive-endangered-and-special-species-on-inaturalist. As you can see, you can change to e.g. only [CRPR](https://rareplants.cnps.org/) listed observations (non obscured of course) by switching to a different project from my list.
There are two big caveats to using iNaturalist in this way, one is observer bias (observations are weighted heavily towards popular areas where humans visit with cameras) and the other is the obscuring of rare taxa.
### Species Density
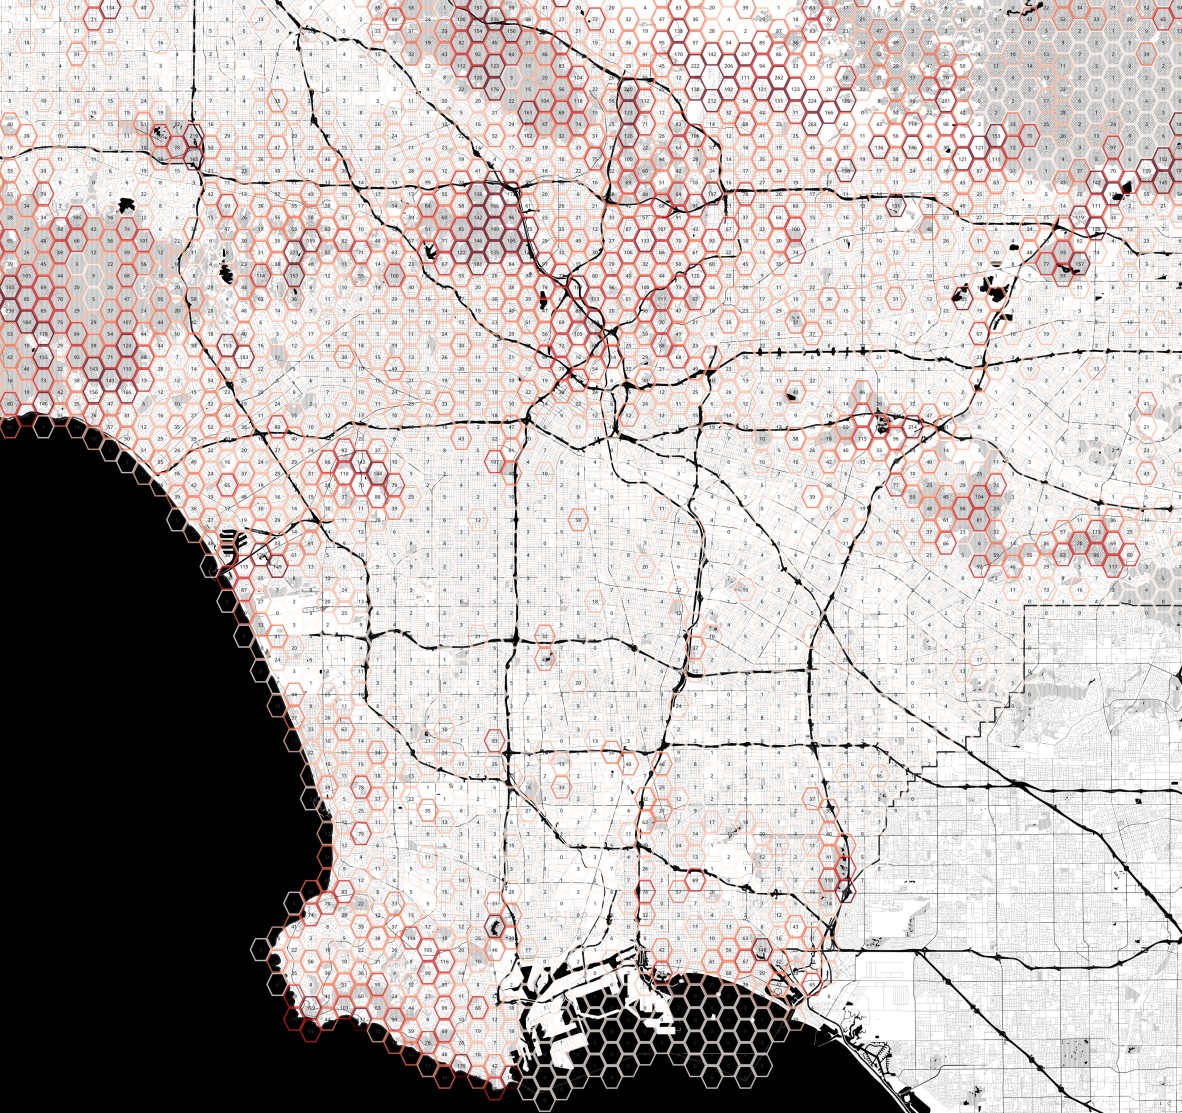
The above map shows observation density, but another way to look at biodiversity is species density. To play around with this, I just whipped up a map using [QGIS](https://qgis.org/) and [this tutorial](https://www.youtube.com/watch?v=ETk1pbGTen0) showing [Kingdom: Plantae observations from GBIF](https://www.gbif.org/occurrence/download/0020325-240906103802322) (which includes most of iNat plus more) from LA County, around ~350,000 observations (I don't have an easy way right now to filter native plants out of GBIF). The map shows the number of unique species in each hex tile.
Species density maps are a cool idea, but the data in LA county is weighted heavily towards trails and roads due to steep, rugged terrain so as you can see most of the San Gabriel Mountains have very low species counts despite having a high biodiversity (hence the need for a comprehensive vegetation mapping initiative here).
[*Download LA County PDF here*](../la-county-plant-species-density-small.pdf)
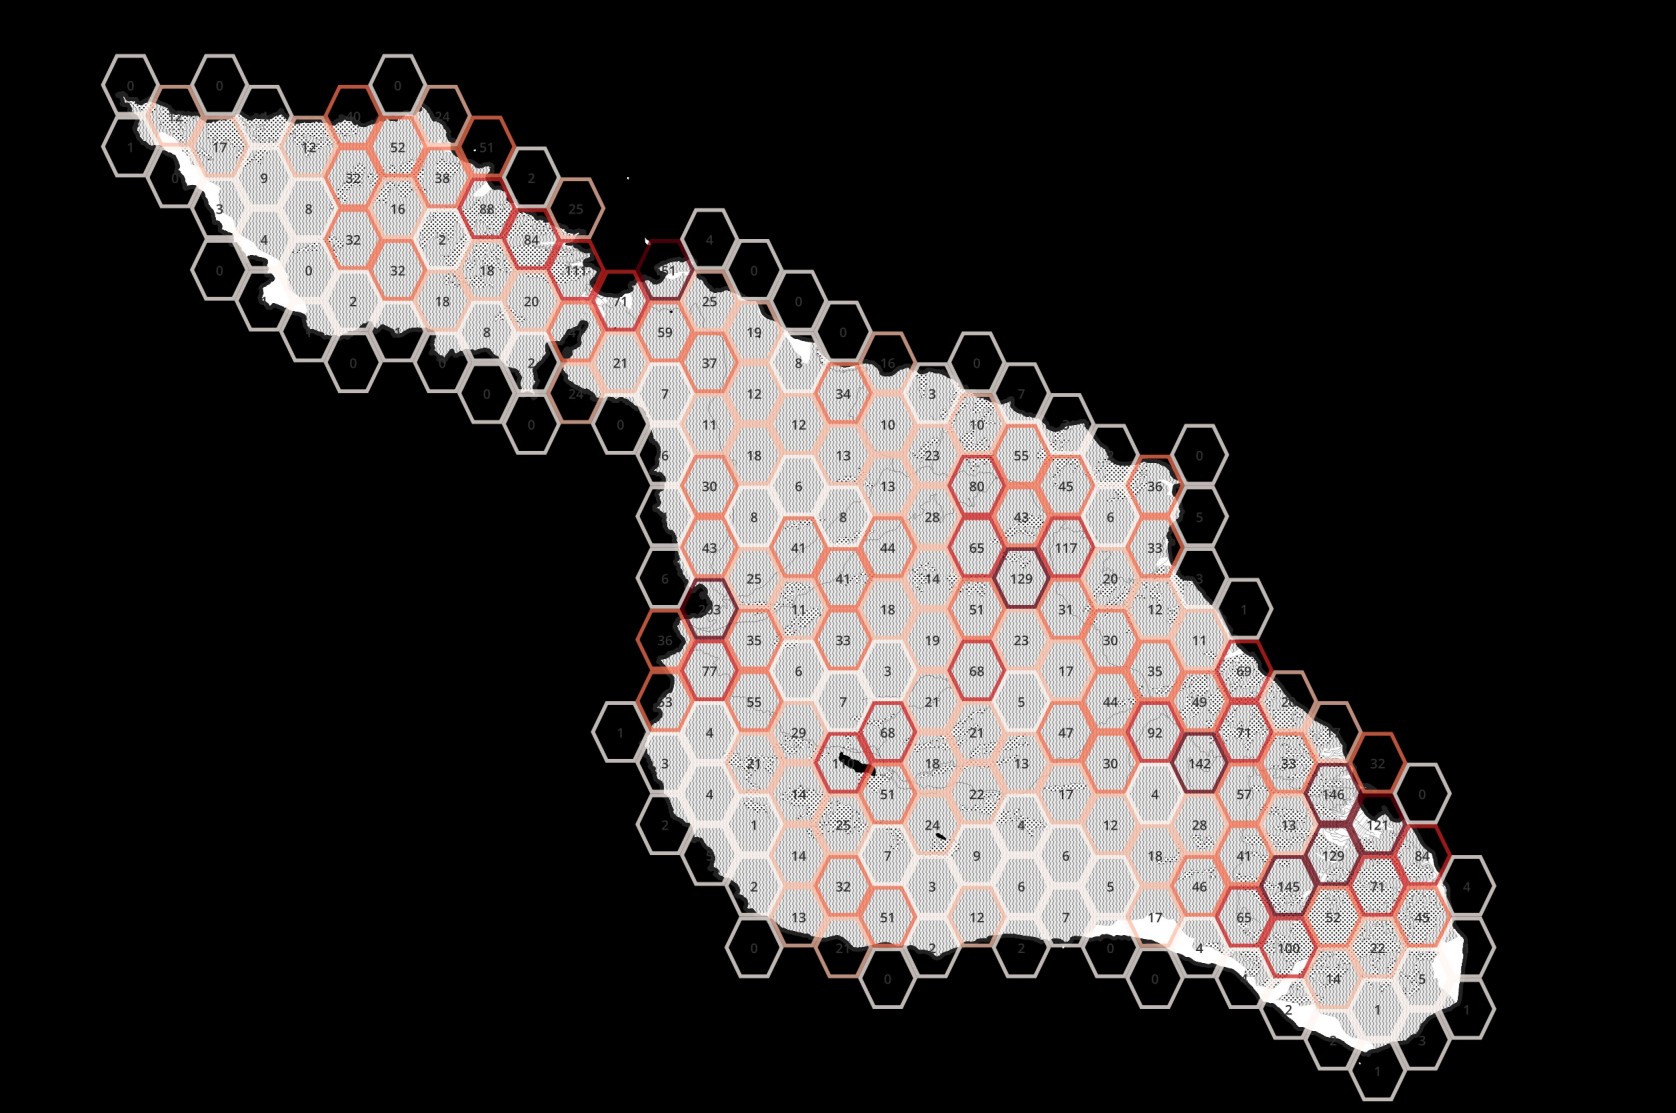
*Plant species per hex grid on Catalina island*
*Plant species per hex grid on Catalina island*
```
GBIF.org (17 September 2024) GBIF Occurrence Download https://doi.org/10.15468/dl.yrmbgg
```
This work by Max Yasuda is licensed under CC BY-NC 4.0 ![]()
![]()
![]()